Calculated Columns in Power BI
Parth Lad
3 min read

In this blog post, I will show you how to use calculated columns in Power BI. Calculated columns are a type of calculated field that you can add to your tables in Power BI. They allow you to perform calculations on the values of other columns in the same table or in related tables. For example, you can use calculated columns to calculate the profit margin, the average rating, the percentage change, etc.
Calculated columns allow you to perform complex calculations and enhance your data model with new information. You can create as many calculated columns as you need for your analysis. To create a calculated column, you need to use the Data Analysis Expressions (DAX) language. DAX is a formula language that lets you create custom calculations and manipulate data in Power BI.
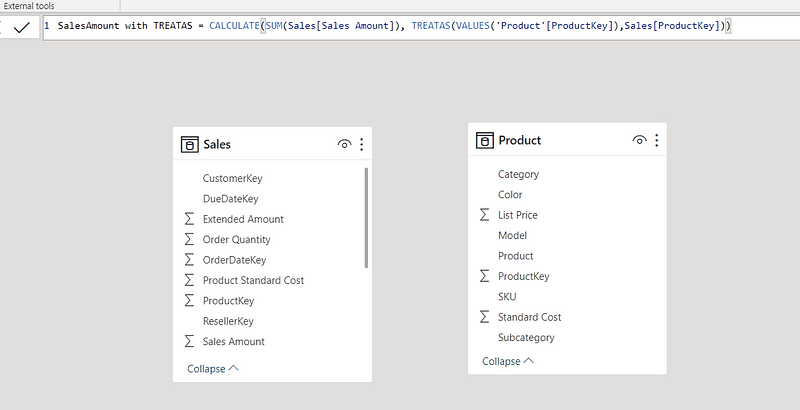
Let’s use the same dataset we’ve used in my previous blog post. The Excel source data contains three tables: Customer, Product, and Sales. The Sales table has the following columns: Order ID, Order Date, Customer ID, Product ID, Quantity, and Sales Amount. The other tables have information about the customers and products.
Let’s say we want to add a calculated column to the Sales table that calculates the profit for each order. To do this, we need to use the following formula:
Profit =
Sales[SalesAmount] - (Sales[OrderQuantity] * 'Product'[StandardCost])
However, we don’t have the Product Cost column in the Sales table. We need to get it from the Product table, which has a one-to-many relationship with the Sales table based on the Product ID column.
To create a calculation column in Power BI, we need to follow these steps:
- Go to the Data view in Power BI Desktop.

2. Select the Sales table from the Fields pane.

3. Click on the New Column button in the Modeling tab.

4. Enter a name for the column, such as Profit.
5. Enter the formula for the column in the formula bar. To refer to another table’s column, we need to use the RELATED function. The syntax is RELATED(TableName[ColumnName]). For example, to get the Product Cost from the Products table, we can use RELATED(Products[Product Cost]). If you would like to learn more about RELATED, do check out my blog post on Power BI DAX’s RELATED vs RELATEDTABLE Function.
The formula for our Profit column should look like this:
Profit =
Sales[SalesAmount] -
(Sales[OrderQuantity] * RELATED('Product'[StandardCost]))
6. Press Enter to create the column.

After creating the column, we can see it in the Sales table along with the other columns. We can also use it in our visualizations and analysis.
Here is an example of a bar chart that shows the total profit by product color:

If you want to add a new column to your data in Power BI, you have two options: a Calculated Column or a Custom Column. A Custom Column is created with Power Query M language and is part of the query transformation process. The choice depends on your needs and preferences, but generally, custom columns are more efficient and flexible than calculated columns. If you are new to Power Query, please check out my blog post on The Power of Power Query.
If you enjoyed this blog post and learned something useful and would like to receive notifications about my new blogs, please follow and subscribe to my Medium account. Also, please don’t forget to give me a clap and save it on your reading list. Stay tuned for my next blog posts with tons of other Power BI tips and tricks. Feel free to leave your comments and feedback below. Thank you for visiting!
Written by
Parth Lad
I'm a data analyst who loves finding insights from numbers and visualizing them. I write about Data Analytics, Data Engineering, Power BI, and DAX on Medium & Hashnode.
Follow me for more!✌️😉