Explicit Measures in Power BI
Parth Lad
4 min read
In Power BI, Measures are calculations that you can create using DAX (Data Analysis Expressions) language, which is a formula language used in Power BI and other Microsoft tools such as SSAS and Excel. You can use measures to get new insights from your data that are not available in the raw data. For example, if you are trying to calculate Sales for the product color “Red”, you can create a measure to achieve that. Measures are used to perform some basic aggregations such as sums, counts, averages, etc. but it’s not just that, you can also create complex logic to create aggregations.
If you are new to Power BI, you must have created visuals by dragging and dropping the fields onto your report page, adjusted the aggregations to Sum, Count, etc., and applied a filter.

These are measures as well, but they are called Implicit Measures. You can use implicit measures for quick calculations and basic analysis. These measures are automatically created by Power BI Desktop based on the fields you select for your visuals or calculations. However, they lack the flexibility and control of explicit measures which are user-defined measures created using DAX (Data Analysis Expressions) formulas.
Explicit Measures give you full control over the calculations and aggregations that you use in your reports. They can also be reused across different visuals or pages in your report, making them more efficient and consistent. It can improve the performance of your reports, especially when dealing with large datasets.
Additionally, you can optimize your calculations and reduce the amount of processing required compared to Implicit Measures as they can add unnecessary overhead to your report by generating additional calculations. Hence, you should always use explicit measures in your reports for greater flexibility, control, and performance.
Let’s get started with creating measures for your Power BI Report.
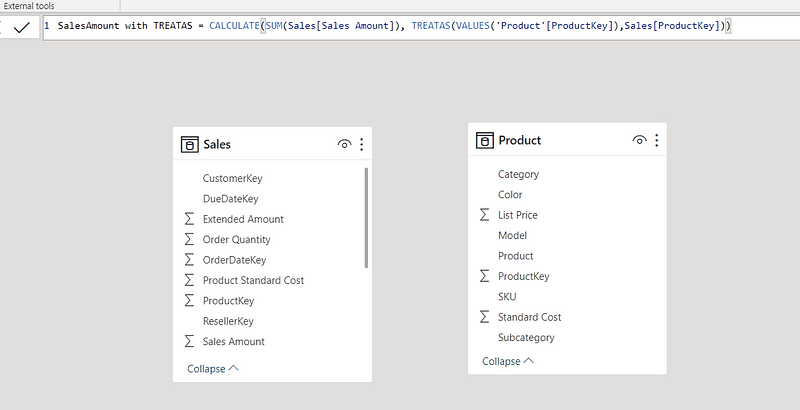
It’s very straightforward. You just need to right-click on the table where you want to store your measure and select New Measure from the menu.

Then you can write your DAX formula in the formula bar, and give your measure a name. You can also change the data type and formatting of your measure if needed just like you would in MS Excel.
Sales Amount = SUM(Sales[SalesAmount])

Once you have created your measure, you can use it in any visualization just like any other field. You can drag and drop your measure to the Values area of the Visualizations pane, and choose how you want to display it. Also, you can use an existing measure as a basis for creating a new measure such as calculating sales for red products. This can save you time and effort when creating new measures.
Sales Amount for Red Product =
CALCULATE ( [Sales Amount], 'Product'[Color] = "Red" )

As you can see, we can break down the Sales Amount by Product Colors and also compare other colors’ sales with red colors’ sales.
Another example, Let’s say you have a table called Sales with columns such as SalesAmount, Quantity, and Product Color. You want to create a measure that calculates the average quantity sold per product color. Here is how you can do it:
1. Right-click on the Sales table and select New Measure.
2. In the formula bar, type the following DAX formula:
Average Sales Quantity= AVERAGE(Sales[OrderQuantity])
3. Change a data type (decimal number).
4. Drag and drop your measure to the Values area of a column chart visualization.
5. Drag and drop the Product Color column to the Axis area of the same visualization.
You can create this measure to show the average quantity sold for each product color in the Sales table. You can also interact with the chart by clicking on any column to filter other visuals on your report page and you can also use your measure in filters, slicers, tooltips, and conditional formatting.
In the next blog, I will share how you can organize the measures and use the quick measures feature available in Power BI Desktop.
If you enjoyed this blog post and learned something useful and would like to receive notifications about my new blogs, please follow and subscribe to my Medium account. Also, please don’t forget to give me a clap and save it on your reading list. Stay tuned for my next blog posts with tons of other Power BI tips and tricks. Feel free to leave your comments and feedback below. Thank you for visiting!
Written by
Parth Lad
I'm a data analyst who loves finding insights from numbers and visualizing them. I write about Data Analytics, Data Engineering, Power BI, and DAX on Medium & Hashnode.
Follow me for more!✌️😉