Power BI Table Relationships 101
Parth Lad
4 min read
If you are working with Power BI, you might have noticed it automatically detects the relationships between tables based on the field name, and data profiling. To build accurate and meaningful reports, it is essential to establish relationships between tables properly. It will allow you to connect different sources and consolidate them into a single data model. Sometimes you might be required to create relationships yourself or make changes to the relationships that Power BI created. By default, some relationship options are automatically set by Power BI such as Cross filter direction, Make this relationship active, and Cardinality.
Let’s understand the different options available in Power BI while creating the relationship in your data model.
To create or modify relationships between tables, please follow these steps:
- Click on Model View

2. Next, click on ‘+’ Icon to create a blank layout

3. Drag and Drop tables from Data

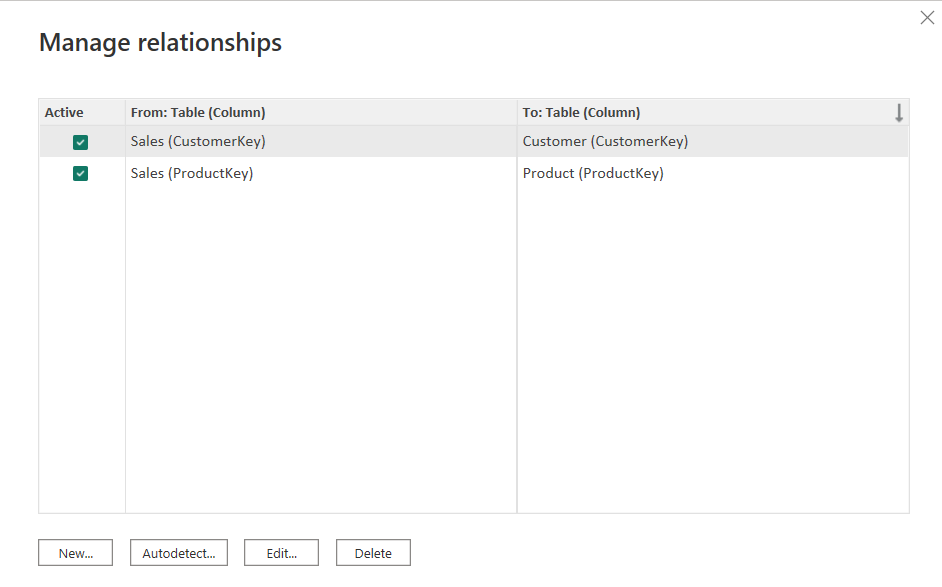
4. Select CustomerKey from the Customer table and drag it on top of CustomerKey in the Sales table, which will create a One-to-Many relationship

5. Double-click the relationship arrow to open the Relationship Setting. Here you can change the relationship columns, cardinality, cross-filter direction, and active checkbox

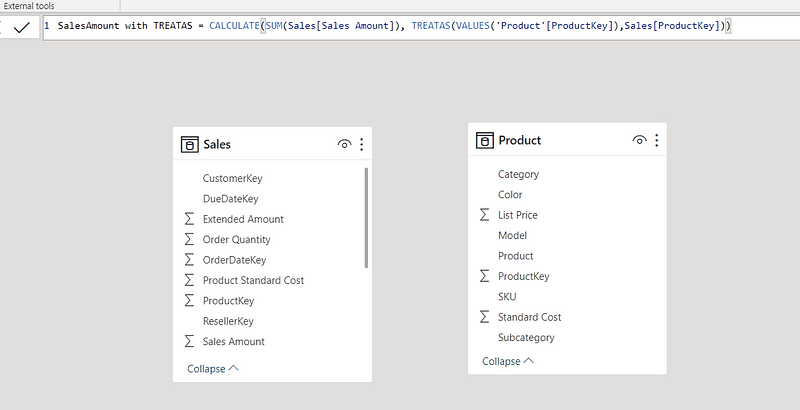
Now, let’s take a closer look at these options and understand if they can be manipulated using DAX:
Cardinality
Cardinality is the property that defines how many rows in one table can match rows in another table.
The Cardinality setting can be one of several options such as:
One-to-Many: In this relationship, a column in one table (Dimension) can have only unique values, and the related table (fact) can have multiple values.
Many-to-One: This is the most common and default relationship type in Power BI. In this relationship, a column in one table (fact) can have multiple values, while the related table (dimension) only contains a single instance of that value.
One-to-One: In this type of relationship, each value in one table matches one value in another table.
Many-to-Many: In this type of relationship, neither of the two tables has unique values for the matched field. It is useful when joining two tables that have multiple values and eliminates the need for a bridging table.
Cross Filter Direction
Cross-filter direction is the property that defines how filters are propagated across tables. For example, In Single, filters only affect the table they are applied to. In Both, filters applied to one table also affect the related table.
In certain calculations, you may need to set the filter direction to both. This can be achieved using the CROSSFILTER DAX relationship function, which allows you to modify the cross-filter property to Single or Both or even remove the relationship entirely.
To learn more about CROSSFILTER, please take a look at my post on the topic.
Make This Relationship Active
The active/inactive status checkbox is the property that defines whether a relationship should be used or ignored by Power BI. For example, if you are calculating sales by customers then the relationship between the Sales and Customer table should be active.
Like the Cross-filter option, you can use DAX to switch between active and inactive relationships by using the USERELATIONSHIP function.
DAX relationship functions are special functions that allow you to access data from related tables in your calculations. They are useful when you want to perform complex calculations that involve multiple tables or columns.
In addition to the ones, we talked about earlier, there are other common DAX relationship functions too, such as
RELATED: This function works exactly like VLOOKUP in Excel. It returns a value from another table that is related to the current row by a single column. For example, if you want to add the Customer name to the sales table, you can use RELATED(Customer[FullName]).
RELATEDTABLE: It returns a table that contains all the rows from another table that are related to the current row by one or more columns. For example, if you want to create a measure that calculates the total sales for each customer, you can use SUMX(RELATEDTABLE(Sales), Sales[Amount]).
These are some of the basics of relationships between tables and DAX relationship functions in Power BI.
References
If you enjoyed this blog post and learned something useful and would like to receive notifications about my new blogs, please follow and subscribe to my Medium account. Also, please don’t forget to give me a clap and save it on your reading list. Stay tuned for my next blog posts with tons of other Power BI tips and tricks. Feel free to leave your comments and feedback below. Thank you for visiting!
Written by
Parth Lad
I'm a data analyst who loves finding insights from numbers and visualizing them. I write about Data Analytics, Data Engineering, Power BI, and DAX on Medium & Hashnode.
Follow me for more!✌️😉