The Power of Power Query
Parth Lad
4 min read
Let’s talk about making your life easier while working with multiple data sources and cleaning raw data, which is often messy and unstructured. To make sense of this data, you need a tool to transform, clean and shape data into meaningful analysis. Power Query is a data transformation and preparation tool that helps you reshape, clean, and combine data from multiple sources. It is a free, self-service ETL (extract, transform, load) tool built into Power BI and Excel.
With Power Query, you can collect multiple data sources, merge tables, pivot and unpivot columns, remove duplicates, and perform a variety of transformations using a user-friendly interface. But, that’s not it! Power Query allows you to use M code, used to create a custom function and perform advanced data transformations.
Let’s use Power Query together to clean and transform your data.
The first thing we want to do is to load the data from this Excel file. From the file, select the sheets you are looking for analysis. Before loading the data directly into Power BI, click on Transform.


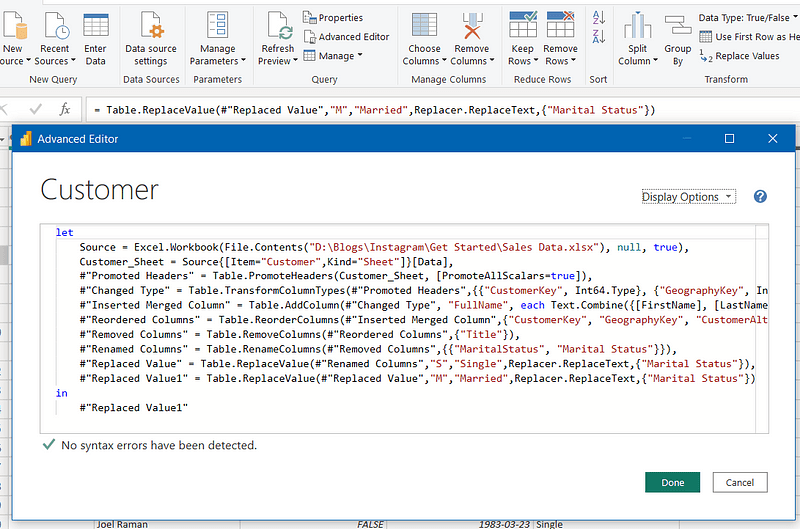
In the Power Query Window, You’ll Find Three Main Areas: The Ribbon, Queries, And Applied Steps. The Ribbon Provides Tools to Clean and Transform Data, Such as Keep/Remove Columns/Rows, Split Column, And Merge/Append Tables. These Transformations Are Recorded as Steps in The Applied Steps Section. Each Table You Import Is Called a Query. Lastly, Each Table You Import Is Called a Query.

Here are some steps to clean and transform data in Power Query along with some examples:
Remove Columns: If Your Data Has a Lot of Columns That You Don’t Need, You Can Remove Them. To Do This, Select the Columns You Want to Remove, Right-Click, And Choose “Remove Columns”.

The “Remove Column” Action Will Be Stored as A Step in The Applied Steps Pane And Can Be Removed by Clicking on the “X” Beside the Step.

In another way, you can choose only the necessary columns and then right-click to choose “Remove Other Columns.” Which should remove the unnecessary columns.
Replace Values: To Replace Values in A Column, Select the Column and Click “Replace Values” In the Ribbon. For Example, To Replace “S” With “Single” And “M” With “Married”, Perform the Same Steps for Each Replacement.


Split columns: If your data has columns that need to be split into multiple columns, you can split them. To do this, select the column you want to split, right-click, and choose “Split Column.” For example, if your data has a column for full name, but you want to split it into first and last name columns, you can split the column.


Rename Column: Double Click on Column Name to Rename It and Enter New Name (First Name)

Filter rows: If your data has rows that you don’t need, you can filter them out. To do this, select the column you want to filter by, click the drop-down arrow, and choose “Text Filters” or “Number Filters.” For example, if you have a table of sales data but you only want to see sales for the year 2013, you can filter the date column to show only the relevant rows.


There are some additional ways to clean and transform data using Power Query. In my upcoming blog, I'll cover more advanced transformations that you can perform using Power Query, including Merge/Append Tables, Pivot/Unpivot, Custom Column, etc.
As you can see, with Power Query, you can manipulate your data in almost any way imaginable. It is a powerful tool that can help you prepare your data for analysis in Power BI and Excel.
If you enjoyed this blog post and learned something useful and would like to receive notifications about my new blogs, please follow and subscribe to my Medium account. Also, please don’t forget to give me a clap and save it on your reading list. Stay tuned for my next blog posts with tons of other Power BI tips and tricks. Feel free to leave your comments and feedback below. Thank you for visiting!
Written by
Parth Lad
I'm a data analyst who loves finding insights from numbers and visualizing them. I write about Data Analytics, Data Engineering, Power BI, and DAX on Medium & Hashnode.
Follow me for more!✌️😉